During the last fifty years, channel diagnosis has taken on an entirely new dimension for patients throughout the world with the discovery of “Ryodoraku” by Dr. Yoshio Nakatani of Japan.
An energetic imbalance within the body’s channel system contributes to many health complaints. For this reason, an evaluation of your channel system is essential. To evaluate these imbalances, we use a hardware/software program called AcuGraph Digital Channel in which we are able to pinpoint areas of instability within your acupuncture channel pathways.
The AcuGraph examination is conducted prior to the administration of any treatment or modality that may alter the bioenergetics of the body. If we discover an elevated or deficient channel from your AcuGraph evaluation, our treatment approach is one of tonification or sedation to specific points for individual channel imbalances or regulation of multiple imbalanced channels that have a historic Yin Yang relationship. The points used are known to regulate or balance the biomagnetic energy in your channel system. These comfortable electronic measurements are ascertained by examining the 24 specific Yuan points (the most active points) on your wrist/hand and ankles/feet.
The integrity of your channel system is important because a channel affects structure and function within the body. Channels become imbalanced as a result of physical trauma, emotional stress or a acute or chronic disease process that can also inhibit the immune response.
Below are some images of the AcuGraph Digital Channel Imaging program.
The Baseline Graph.
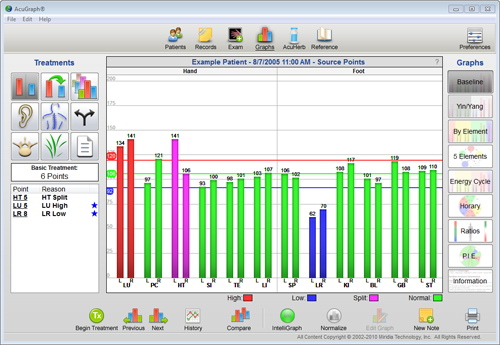 The Baseline graph is the traditional, Ryodoraku-style graph used in channel graphing. Channels are displayed with arm yin channels first, followed by arm yang, then leg yin and leg yang.
The Yin/Yang graph displays all the yin channels on the left half and the yang channels on the right half. It also gives the average reading for yin and yang, allowing comparison of the patient’s yin/yang balance.
The By Element graph displays the exam results as coupled channels within each element, and gives the average reading for each element. This graph promotes 5-elements analysis by showing the relative balance among the 5 elements. The shaded area behind the bars within each element illustrates the average for that element.
The Energy Cycle graph displays the channels in their horary order, beginning with Lung. This graph style is useful for analyzing the patient’s energetic balance throughout different periods of the day.
In each of the above graph types, there are three horizontal lines superimposed on the graph. The middle line is the Mean, or average, of that patient’s readings. The upper and lower lines represent the normal range of readings for that patient. Channels with at least one reading in this normal range will be displayed as normal (except in the case of splits; see below.) Channels with both readings above this range will be displayed as excessive, and channels with both readings below this range will be displayed as deficient.
Split Channels: When there is a statistically significant difference between the right and left readings on a given channel, that channel is considered “Split†and will be given special treatment. If a channel is split, it will not be displayed in any other way, even if it would otherwise be considered excessive, deficient, or normal. A split condition takes precedence over other considerations for any given channel.
 The 5 Elements graphic displays the classic 5-elements chart with the relative excess (+), deficient (-), split (X), and normal (=) channels noted. Element averages are also shown. This display is designed to facilitate understanding of 5-elements energy transfers for this patient.
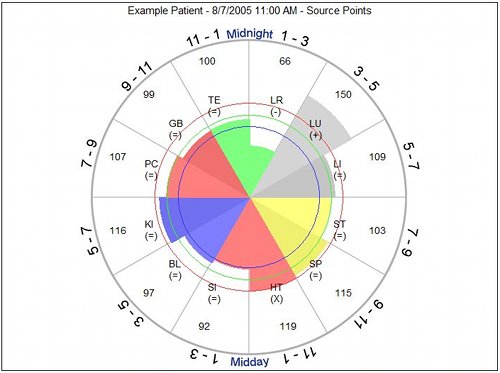
The Horary graphic displays the horary chart with superimposed shading to show the relative energy level of each channel. This graphic is useful for understanding the patient;s energetic condition at various times of day.
The Ratios display gives information about the patient’s relative energy balance.
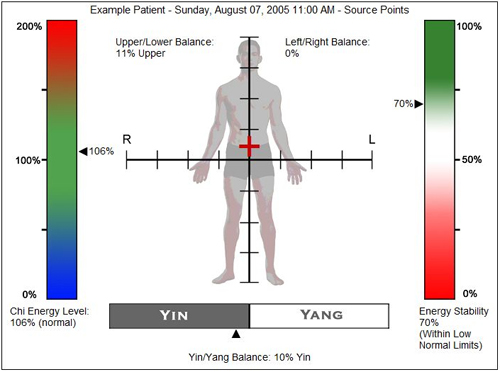
Within this display, there are several categories of balance shown. On the left is the Chi Energy Level. This is a representation of the patient’s overall energetic level. Note that it is possible for the patient to be too low or too high in energy, and the ideal reading level is in the green area toward the center of the vertical display bar.
The bottom center shows the Yin/Yang Balance for the patient, with the yin/yang tendency noted.
The right side of the display shows the patient’s Chi Energy Stability. This is determined by analyzing the highest and lowest readings in the exam, in relative comparison to the mean. Patients with a wider range of readings from high to low will have lower relative energy stability. The green area towards the top of the display represents the best balance.
The center of the display shows the Right/Left and Upper/Lower balance superimposed on a human figure.
The P.I.E. Graph stands for Personal Integrated Energetics graph. This graph provides a snapshot of the patient’s overall channel balance.

Within this graph, each channel is represented by a color-coded slice of the pie. Energetically healthy channels extend fully to the edge of the circle and are colored green. Energetically unhealthy channels do not extend fully to the edge of the circle. The smaller the shaded section of the pie slice, the lower the health level of the channel. Additionally, channels are color-coded according to imbalance, with red for excess, blue for deficiency and purple for split.
In the center is the P.I.E. score, which stands for Personal Integrated Energetic score, and this single number comprises a complete picture of your patient’s channel health. The higher the score, the better the health. Statistical analysis methods are used to include all facets of channel health in the score calculation. The purpose of the score is to provide a fast, easy method of graph comparison for your patient.
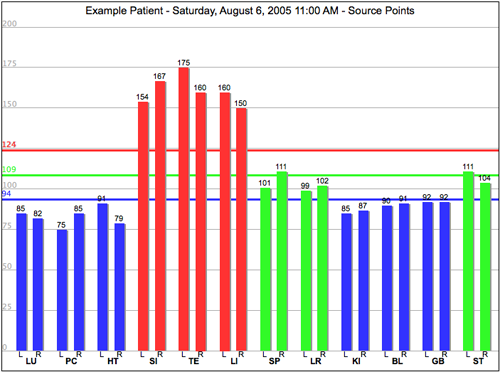 The Normalization Graph
You will notice that many of the patient’s channels in this example are just below the normal range (LU, PC, HT, KI, BL, GB) and that three channels are excessively high (SI, TE, LI.)
The effect of the three high channels is to raise the mean to the point that many of the borderline channels appear low when they really aren’t deficient.
By clicking the normalize button, you will eliminate the effect of the 3 excessively high channels on the mean, and the 6 deficient channels will be automatically re-categorized into their correct category of “Normal.” The treatment protocol goes from requiring stimulation of 18 points in the basic protocol and 10 points in the 5-elements protocol, to only requiring 6 points (basic) and 2 points (5-element). Thus, normalization prevents over-treatment of the patient.
Note that normalization does NOT remove the outliers (excessively high or excessively low channels) from the treatment protocol. It only removes them from the calculation to prevent artificially skewing the results. The outlying channels are still treated and corrected.